Log in
Sign up
Learning Tools
Curriculum
All math topics
Show more
Games
Multiplication Master
Junior Math
Show more
Invite a Friend
Curriculum
Select curriculum
Log in
...
>
Statistics and Probability
>
Statistics
Statistics
Overview and Exam Tips
Numbers and Quantities
Algebra
Geometry
Statistics and Probability
Statistics
Probability and Combinatorics
Functions
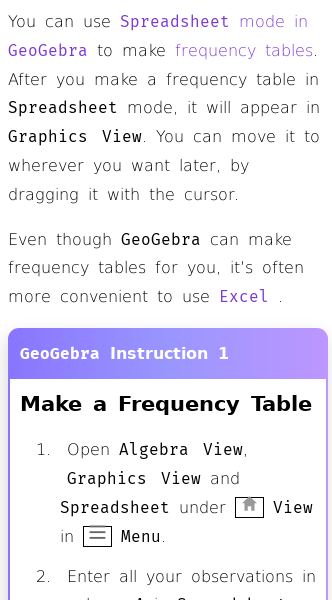
How to Make a Frequency Table with GeoGebra
Read here
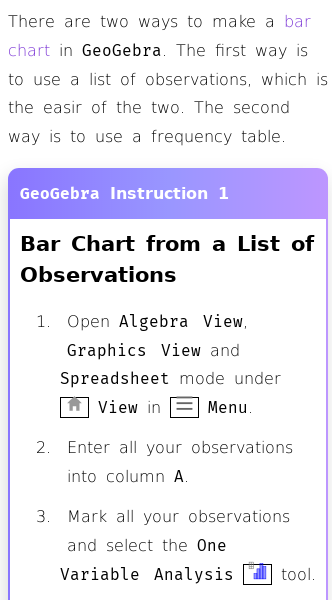
How to Make a Bar Chart with GeoGebra
Read here
How to Make a Pie Chart with GeoGebra
Read here
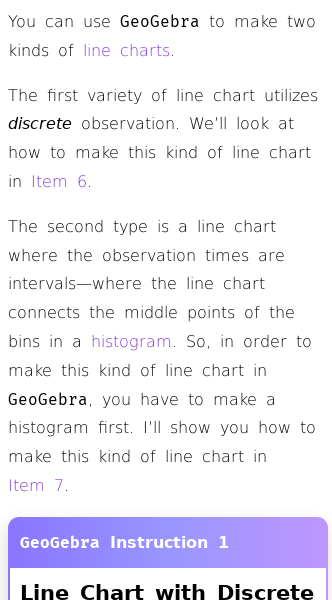
How to Make a Line Chart with GeoGebra
Read here
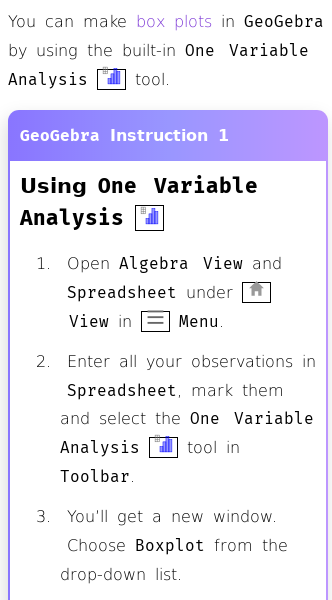
How to Make a Box Plot with GeoGebra
Read here
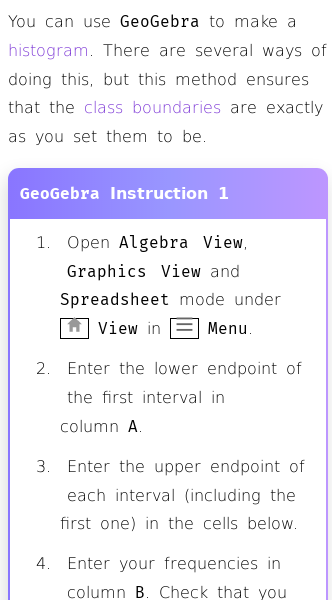
How to Make a Histogram with GeoGebra
Read here
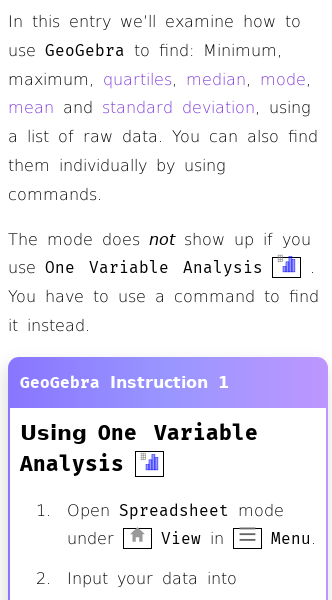
How to Calculate Central Tendencies with GeoGebra
Read here
Go back
Home
Curriculum
How can I help you?
Send
Stats
League