How to Find Mean of Grouped Data in Excel
Excel Instruction
Finding the Mean of Grouped Data
- 1.
- Make a frequency table in
Excel. - 2.
- Add two new columns: One for the midpoint of each group, and one for the product of the midpoint and the frequency.
- 3.
- Enter the formulas in the two new columns.
- 4.
- Find the sum of the column representing the product of the midpoint and the frequency, and divide this by the sum of the frequency.
Now you have found the mean!
Example 1
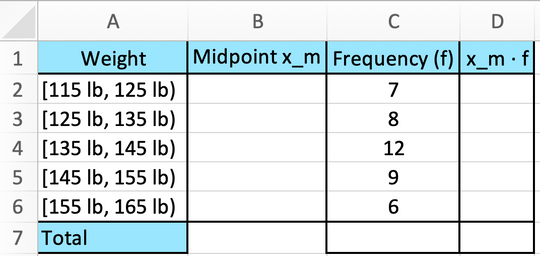
A group of skaters are distributed into different weight classes. Here’s a table showing the classes and the frequency of each class.
| Weight | Frequency |
| 7 | |
| 8 | |
| 12 | |
| 9 | |
| 6 | |
Find the mean weight of this group.
- 1.
- You can see the frequency table of the weight distribution above. The first thing to do is to enter the numbers in
Excel. - 2.
- Add the columns “Midpoint ” and “”. The last column is the product of the midpoint and the frequency. Your table should now look like this:
- 3.
- As you don’t know the exact weight of everyone in the weight class (it could be anywhere between lb- lb, lb- lb, etc.) you have to assume that the weight of everyone in each weight class is in the exact middle. This would be the average of the numbers 115 and 125 for the first, 125 and 135 for the second, and so on.
Write the following formula in cell
B2:=(115+125)/2
Enter the formula for calculating the mean in the remaining weight classes in the column representing the midpoints.
In the “”-column, write the following formula in cell
D2:=B2*C2
Mark cell
D2and copy the formula all the way down to cellD6. - 4.
- Now find the sum of the numbers in the frequency and “” columns. Write the following in cell
C7:=SUM(C2:C6)
And write the following in cell
D7:=SUM(D2:D6)
Finally, you’ll find the mean by dividing the number in cell
D7by cellC7.In cell
B9, write:=D7/C7
Here are the formulas for each cell:
You can now see that the mean weight for this group is lb.