How to Make a Cumulative Frequency Table in Excel
When you have data where the categories are ordered, you can calculate their cumulative frequency. Ordered means that the categories have a natural sorting. An example of this would be integers, which are in number order. Another example would be letter grades—A, B, C, D, and F.
Below you’ll learn how to make a cumulative frequency table in Excel.
Excel Instruction
Cumulative Frequency Table
- 1.
- Make the “skeleton” of the table. You’ll need columns for frequency and cumulative frequency in addition to a column with the different categories. Enter the frequencies of all the categories.
- 2.
- Calculate the cumulative frequency of all the categories.
- 3.
- (Optional) Add an extra column in the table for relative cumulative frequency.
- 4.
- (Optional) Change from decimal numbers to percentages in the relative cumulative frequency column.
Example 1
Cumulative Frequency Table
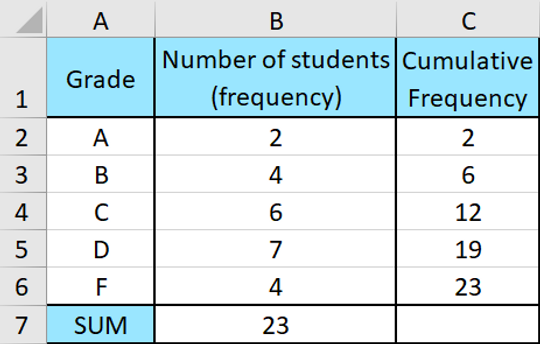
Below you see a frequency table of the grade distribution within a school class.

Make a relative frequency table of the grade distribution.
It’s certainly useful to know how many students received a grade of B in a class. This is the frequency of the category for “Grade B”. It can also be interesting to know how many students who got a B or a higher grade. You can determine this by using the cumulative frequency.
You’ll now see how to make a table with a cumulative frequency for the table above.
- 1.
- Plot the frequency table into a spreadsheet and make a new column called “Cumulative Frequency”.
- 2.
- Now you need to enter a formula in cell
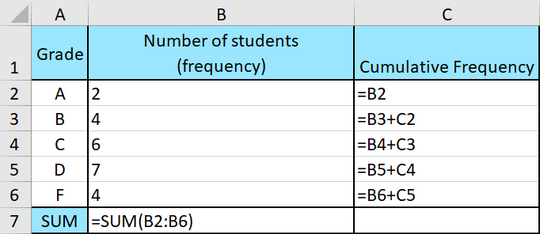
C2. In this cell it should show how many students received the grade A or higher. Since there is no higher grade, you only need to count the number of students who received an A. So write:=B2
Now you’ll make a formula that calculates how many got the grade B or higher. You’ll do this by adding the number of students who received a B to the previous cumulative frequency—the students who received an A or higher.
In cell
C3, write=B3+C2
Then highlight cell
C3and copy the formula down to cellC6. The table looks like this:Here are the formulas for each cell:
- 3.
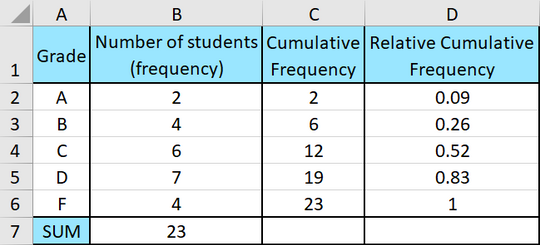
- (Optional) Add the relative cumulative frequency. Now that you know what cumulative frequency means, you can also calculate the kind of frightening term relative cumulative frequency. For example, will the relative cumulative frequency of those who got a C, be the same as the number of students who got a C or higher? You have already figured out how many who got a C or higher. The only thing that’s missing is dividing the result by the total number of students in the class:
Here are the formulas for each cell: